Placeholder Image

Subtitles section Play video

  • Unity's built-in profiler

  • allows us to quickly and accurately

  • assess the performance of our games.

  • Using this information we can keep our scenes running

  • smoothly and efficiently.

  • In Unity we can access the profiler

  • by clicking Window - Profiler.

  • Or by pressing Control-7 in Windows

  • or Command-7 on a Mac.

  • The profiler window functions just like every other

  • Unity editor window and can be easily docked

  • so that it is more readily available.

  • Once the profiler is open

  • statistics will be collected about our scene

  • every time it is run.

  • Let's run our scene now and pause execution

  • after a few frames.

  • Now that the profiler has some data,

  • we can begin examining it.

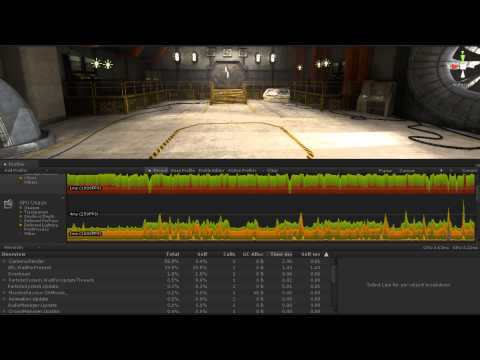
  • The profiler window itself is split in to 3 sections.

  • The first is the profiler area section

  • where we can see the various measurements being recorded.

  • Next we have an overview

  • where we can get a detailed breakdown

  • of each profiler area.

  • Finally we have the pre-object display

  • where we can get information about the

  • items in our overview.

  • By default the profiler measures CPU usage, GPU usage,

  • rendering performance, memory usage, audio,

  • and physics for both 3D and 2D.

  • Any of these can be selected to get more information

  • in the overview window.

  • To the right of the profiler area section

  • is a color chart outlining the specific performance

  • of different pieces of each area.

  • For instance, in the CPU Usage component,

  • we can see that rendering usage is freed

  • whilst Script Performance is blue.

  • We can switch these different sections on

  • and off by clicking the box next to their names.

  • Clicking anywhere in the color chart will give you a vertical line.

  • The line represents a specific frame of recorded data.

  • We can see what frame we are on

  • and the total number of frames

  • by looking at the frame count in the upper righthand corner.

  • We will also see some numbers appear around our line.

  • These numbers represent the amount of time

  • in milliseconds each of the sessions took

  • during that specific frame.

  • Obviously lower numbers mean faster games.

  • We can see the specific information for the selected frame

  • in the overview section.

  • Items in the overview section with an arrow next

  • to them can be expanded for more information.

  • With all of this information at your fingertips

  • you will be able to more readily determine

  • the performance of your games and optimise them.

Unity's built-in profiler

Subtitles and vocabulary

Click the word to look it up Click the word to find further inforamtion about it