histogram
US
・UK
C2
n. (c.)Countable NounBar chart representing a frequency distribution
The histogram shows it continues to move higher until 2015, then it drops
Video subtitles
How I Edit My Photos!
- Now, when I look at this photo and I take a look at the histogram, I can see that a lot of information is sort of in the middle, right?
Now, when I look at this photo and I take a look at the histogram, I can see that a lot of information is sort of in the middle, right?
- Now, when I look at this photo and I take a look at the histogram, I can see that a lot of information is sort of in the middle, right?
Now, when I look at this photo and I take a look at the histogram, I can see that a lot of information is sort of in the middle, right?
ProShot Video Tutorial (2021)

- Here you can adjust a variety of settings such as location tagging, histogram, interface theme, and more.
Here you can adjust a variety of settings such as location tagging, histogram, interface theme, and more.
- Here you can adjust a variety of settings such as location tagging, histogram, interface theme, and more.
Here you can adjust a variety of settings such as location tagging, histogram, interface theme, and more.
Real Estate Photography Tips Lightroom Post Processing With Enfuse HDR Blending
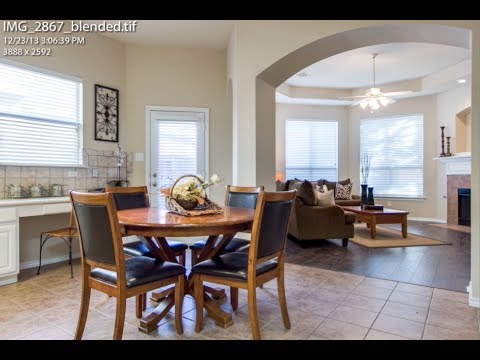
- I usually pay attention to the histogram a little bit.
I usually pay attention to the histogram a little bit.
- bit brighter. I usually pay attention to the histogram a little bit, I want
bit brighter. I usually pay attention to the histogram a little bit, I want
Exposing Lightroom's Mystery Tool You Never Knew Existed!

- And if you look at the histogram, if you watch this line right through here, as I move this across the scene, you'll notice that it is starting to move.
And if you look at the histogram, if you watch this line right through here, as I move this across the scene, you'll notice that it is starting to move.
- And it works just like a histogram.
And it works just like a histogram.
The 7 Quality Control (QC) Tools Explained with an Example!

- We're going to start with the flowchart, the check sheet, the Pareto chart, the cause-and-effect diagram, scatter diagram, histogram, and
We're going to start with the flowchart, the check sheet, the Pareto chart, the cause-and-effect diagram, scatter diagram, histogram, and
- And one of the ways you could analyze that data is with a histogram.
And one of the ways you could analyze that data is with a histogram.
Steve Huffman reveals Reddit's path to 1 billion Users

- Like, if you did a histogram of days per week, the two biggest bars would be seven days a week and one day a week.
Like, if you did a histogram of days per week, the two biggest bars would be seven days a week and one day a week.