graph
US /ɡræf/
・UK /græf/
A2TOEIC
n. (c./u.)Noun (Countable/Uncountable)Image expressing numerical data in lines or shapes
The graph shows how our business is improving
v.t.Transitive VerbTo show data using images
The graph shows how the budget is divided
Video subtitles
How About That...

- Like, they have nothing to do with what I do, so it wouldn't make any sense." Well, here's a graph showing the trust in media going down based on age.
Like, they have nothing to do with what I do, so it wouldn't make any sense." Well, here's a graph showing the trust in media going down based on age.
- Here's a graph of the newspaper ad revenue from digital and print showing decrease of revenue in the media.
Here's a graph of the newspaper ad revenue from digital and print showing decrease of revenue in the media.
The Pizza Equation
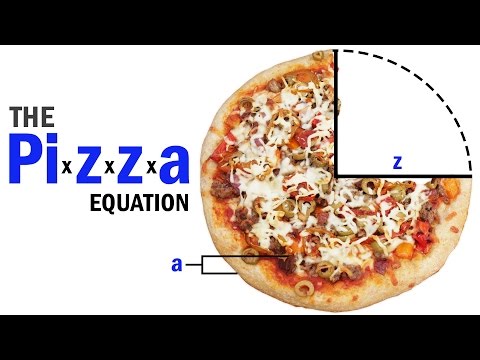
- In fact, NPR did a study of over 74,000 pizza prices in America and created an interactive graph to show exactly how the price of pizza changes with size and how much more pizza you get when you order a large.
In fact, NPR did a study of over 74,000 pizza prices in America and created an interactive graph to show exactly how the price of pizza changes with size and how much more pizza you get when you order a large.
- graph to show exactly how the price of pizza changes with size, and how much more pizza
graph to show exactly how the price of pizza changes with size, and how much more pizza
5 Healthy Habits that help you to have the Best Sleep!

- If I show that in a graph, it looks like this:
If I show that in a graph, it looks like this:
- If I show that in a graph, it looks like this.
If I show that in a graph, it looks like this.
Incremental Models (Faisal El Shami)

- And on the right, this is just a graph on Looker.
And on the right, this is just a graph on Looker.
- And on the right, this is just a graph on Looker.
And on the right, this is just a graph on Looker.
how to take neat notes on a budget

- The first tip is to use ruled or graph paper for your notes.
The first tip is to use ruled or graph paper for your notes.
- For people with inconsistent or slanted handwriting, using ruled or graph paper will help you keep the lines of your writing straighter and more aligned, which improves the overall neat vibe of your notes.
For people with inconsistent or slanted handwriting, using ruled or graph paper will help you keep the lines of your writing straighter and more aligned, which improves the overall neat vibe of your notes.
I Analysed 100 Years of Gold Prices, This Is What I Found
- So historically, by looking at this graph, you see that gold has been some of the best investments somebody could possibly make.
So historically, by looking at this graph, you see that gold has been some of the best investments somebody could possibly make.
- So historically, by looking at this graph, you see that gold has been some of the best investments somebody could possibly make.
So historically, by looking at this graph, you see that gold has been some of the best investments somebody could possibly make.
Workplace English

- If you look at the graph, after that peak, there's a noticeable decline in sales.
If you look at the graph, after that peak, there's a noticeable decline in sales.
- If you look at the graph, after that peak, there's a noticeable decline in sales.
If you look at the graph, after that peak, there's a noticeable decline in sales.
How American Cars Got So Bad

- This is a graph of the share of total light vehicle sales between passenger cars and light trucks.
This is a graph of the share of total light vehicle sales between passenger cars and light trucks.
- This is a graph of the share of total light vehicle sales between passenger cars and light trucks.
This is a graph of the share of total light vehicle sales between passenger cars and light trucks.
Will Trump’s “Big Beautiful Bill” Bankrupt America?

- And if you look at the graph that you see in front of you, under the current legislation, by 2034, which is in 10 years from now, the debt to GDP ratio would have grown to 117%.
And if you look at the graph that you see in front of you, under the current legislation, by 2034, which is in 10 years from now, the debt to GDP ratio would have grown to 117%.
- And if you look at the graph that you see in front of you, under the current legislation by 2034, which is in 10 years from now, the debt to GDP ratio would have grown to 117%.
And if you look at the graph that you see in front of you, under the current legislation by 2034, which is in 10 years from now, the debt to GDP ratio would have grown to 117%.
[ 中英字幕] 實用商業會議英文 English for Business Meetings( 區分正式/非正會議,各階段看時間軌 )
![[ 中英字幕] 實用商業會議英文 English for Business Meetings( 區分正式/非正會議,各階段看時間軌 )](https://img.youtube.com/vi/oNj_YB5ZKZo/hqdefault.jpg)
- declining during the past 12 months and the reasons for that decline then ms graph will
declining during the past 12 months and the reasons for that decline then ms graph will
- graph shows that these figures have held steady over the four months we've conducted these focus
graph shows that these figures have held steady over the four months we've conducted these focus